How to Read a Candlestick Chart
1:33 video · 6 sections
Welcome. In the next two minutes you will learn how to read a candlestick chart. The chart almost every trader uses. We will look at what one candle means, how to spot a trend, and two simple patterns.
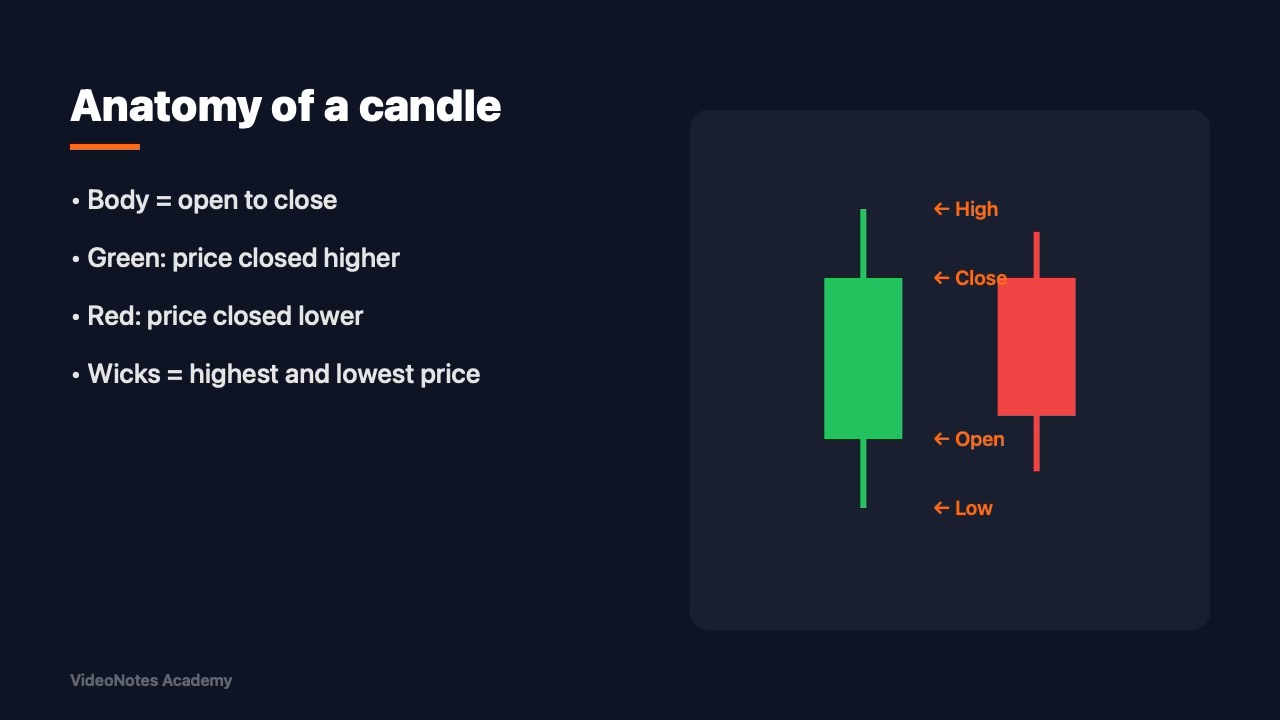
Each candle shows one period of time, for example one hour. The thick body goes from the opening price to the closing price. A green candle means the price closed higher than it opened. A red candle means it closed lower. Lines, called wicks, show the highest and the lowest price of that period.
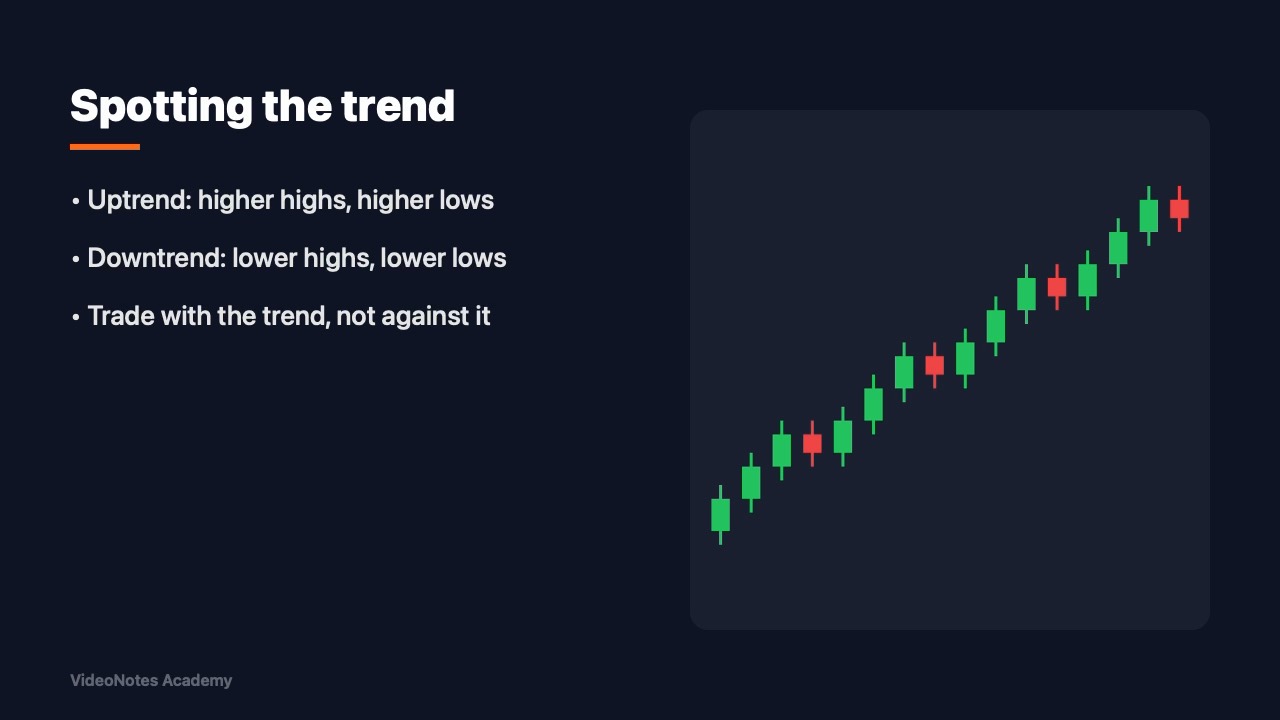
Now zoom out. When each high is higher than the last one, and each low is also higher, the market is in an uptrend. The opposite, lower highs and lower lows, is a downtrend. Most beginners lose money by fighting the trend, so trade in its direction.
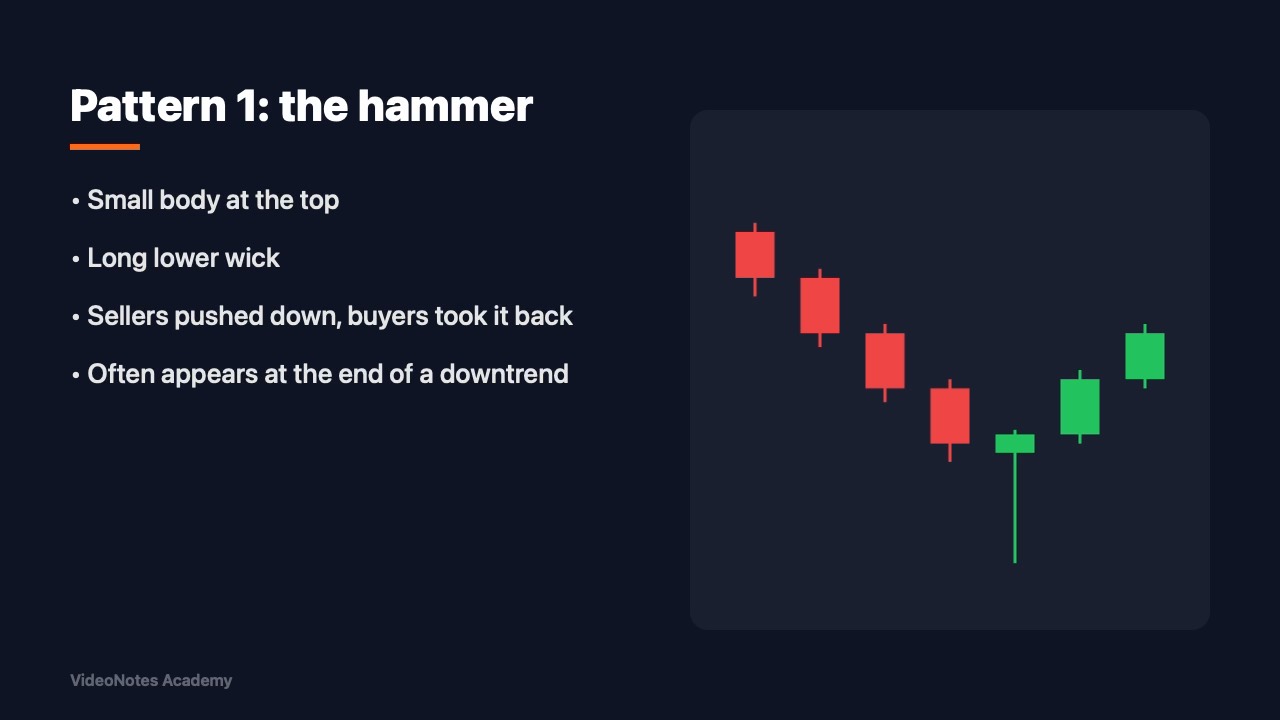
Our first pattern is the hammer. It has a small body near the top and a long lower wick. It tells you that sellers pushed the price down, but buyers took it all back before the close. A hammer after a downtrend is often a sign that the fall is ending.
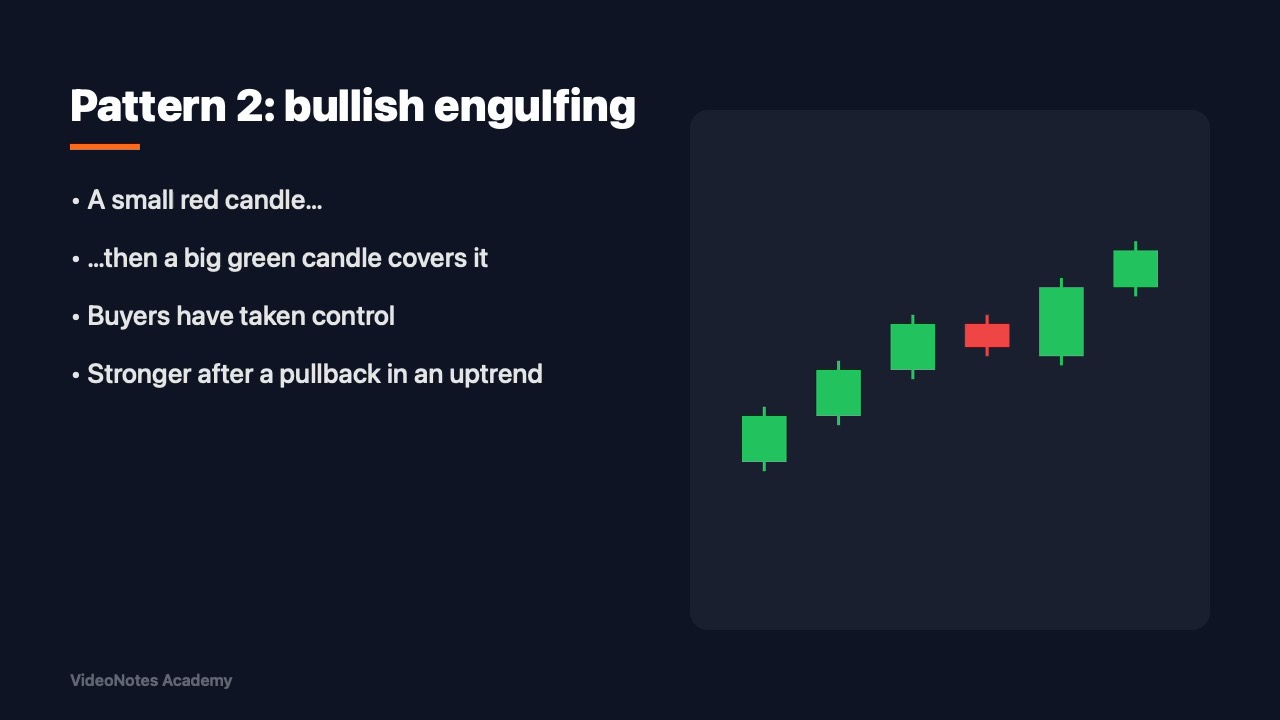
The second pattern is the bullish engulfing. First comes a small red candle, then a big green candle opens lower and closes above the red one, swallowing it completely. It shows that buyers have taken control. It works best after a small pullback inside an uptrend.
To sum up, the body and the color tell you who won the period, the wicks show the fight, follow the trend, use patterns as clues and never as a guarantee, and always protect yourself with a stop loss. Thanks for watching.